
Building Dashboards with AI

In short:
“Dashboards are dead, reporting is dead.” Now that AI agents can supposedly answer any question about your data, you hear this a lot. At Raw & Roasted on October 29, 2026, Jörg Hopmann showed a different picture: building dashboards with AI gets you a convincing report in very little time. But it only becomes reliable when combined with human expertise. AI speeds up a lot of the work, and experienced people create the trust in the numbers. The companies with the most leverage on budget and decisions are the ones that first agree on which metrics matter and who owns the rules.
- Dashboards remain the tool for orientation and a shared view of the business. AI speeds up mockups, design and alignment, and complements dashboards when it comes to exploration.
- With a briefing, raw data and brand guidelines, Claude builds an interactive dashboard with SEO analysis and recommendations in about 30 minutes.
- The biggest return comes from better budget decisions. Time saved is the smaller part of the equation.
- A semantic layer and a context layer make sure AI dashboards show reliable numbers.
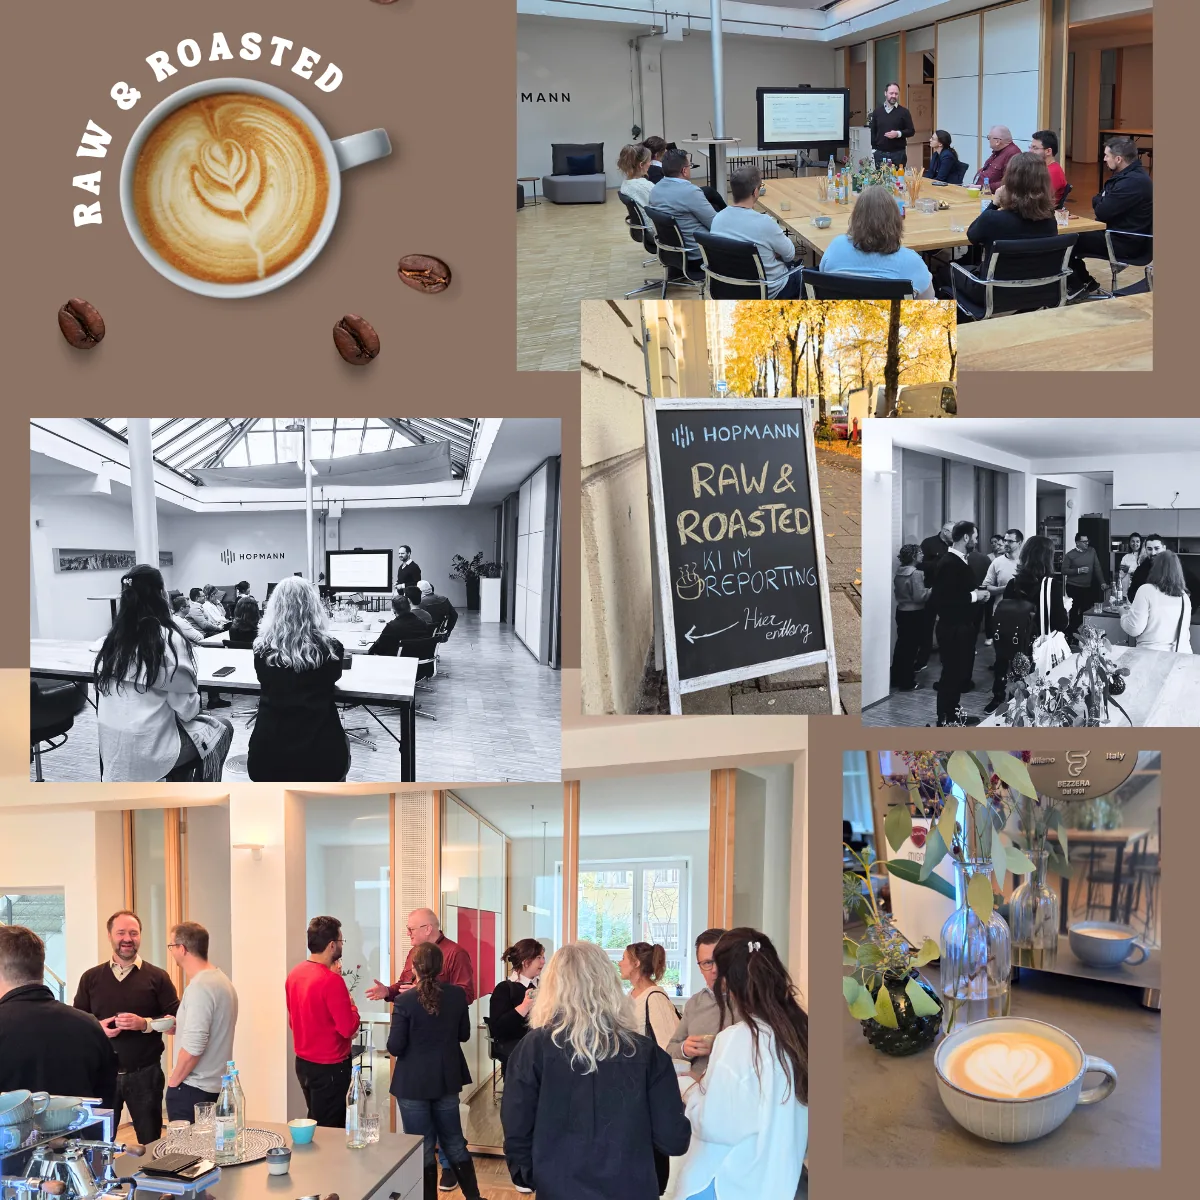
Raw & Roasted: What was the event about?

Jörg’s answer to the opening question: dashboards are not dead. They give orientation when you don’t yet know which question to ask, and they create a shared view of the business. What AI changes most is how dashboards are built: mockups, design and feedback rounds with business teams move much faster. And anyone who wants to dig deeper can ask AI questions about the data without knowing SQL.
Building dashboards with AI: the live demo
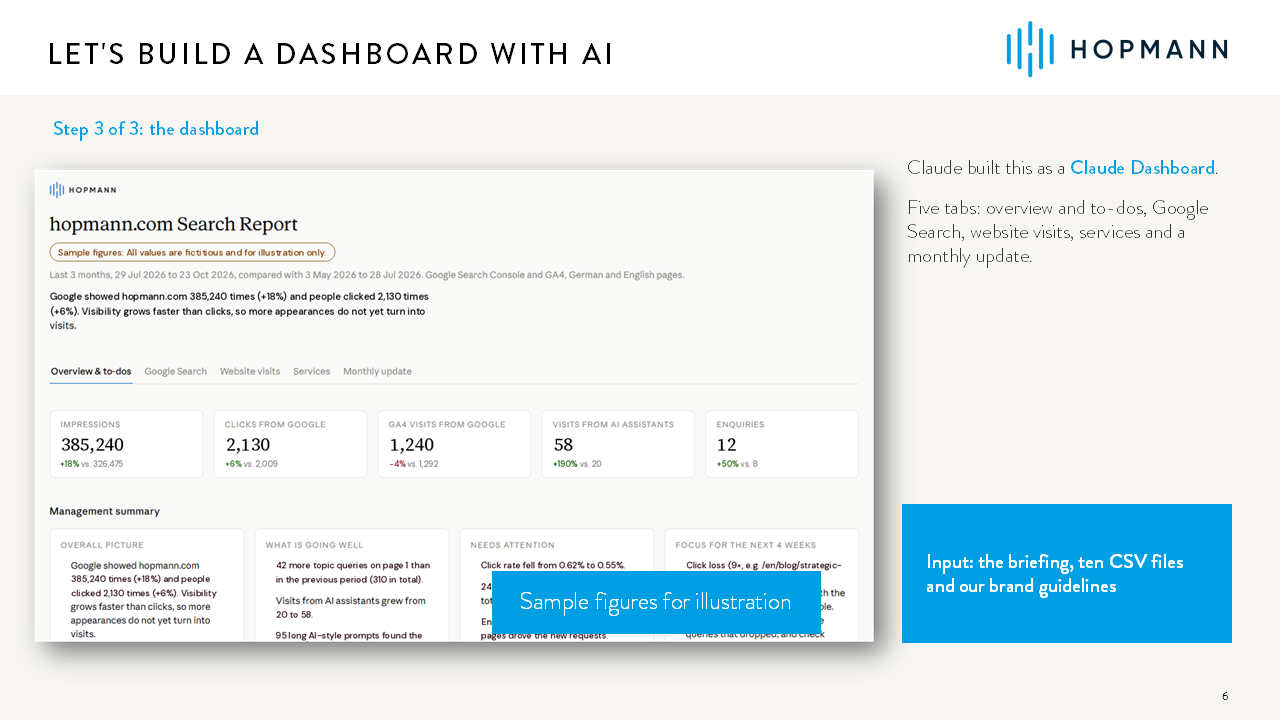
Jörg showed live how easy building dashboards with AI has become. The ingredients: ten CSV exports from Google Search Console and GA4, our brand guidelines and a one-page briefing in Markdown. The briefing explains what the report is for and who reads it, in this case our own marketing team.
From this, Claude built an interactive HTML dashboard with five tabs, including a detailed SEO analysis and recommendations. The total effort was about 30 minutes, including the briefing and a few smaller changes. The dashboard shows what went well, where attention is needed and what the team should focus on over the next four weeks.
Jörg repeated the same test with the open-source model DeepSeek on a secure server in Germany. The result was comparable, and the build took a little longer. In return, data and costs stay fully under your own control, a real gain in data sovereignty.
More examples from the demo
Business case calculator for marketing mix modeling: In Excel, Claude built a calculator, formulas included, that shows whether a marketing mix modeling project pays off. It calculates the payback period and the net present value over three years and runs scenarios from 1 to 15 percent efficiency gain. Enter your own numbers and you see right away how much even small improvements in budget allocation can achieve. This also makes it easy to bring other business stakeholders on board: they see the value of MMM in their own numbers and can decide faster.
The dashboard in Power BI: Based on the HTML dashboard, Claude created a Power BI version with a spec, a data model including DAX and a finished report. This is possible thanks to text-based Power BI files, the Power BI MCP server and Power BI skills from Microsoft. Anyone who knows Power BI would have built parts of the data model for better performance. Experience remains the deciding factor.
Explainer video for management: A new dashboard needs attention inside the company. Inspired by Claude Motion, Jörg created a 60-second explainer video, deliberately with an open-source model: DeepSeek combined with Remotion, a framework that renders videos from code. It’s a compelling way to present your own work internally instead of just sending a link to the new dashboard.
And how reliable are the results? Jörg wouldn’t fully trust them yet for a company-wide rollout. But they offer a very good first orientation that you can build on and refine step by step. The data foundation is what counts.
Direction, trust and governance: what AI dashboards need
When business teams build their own reports with AI, new questions take center stage.
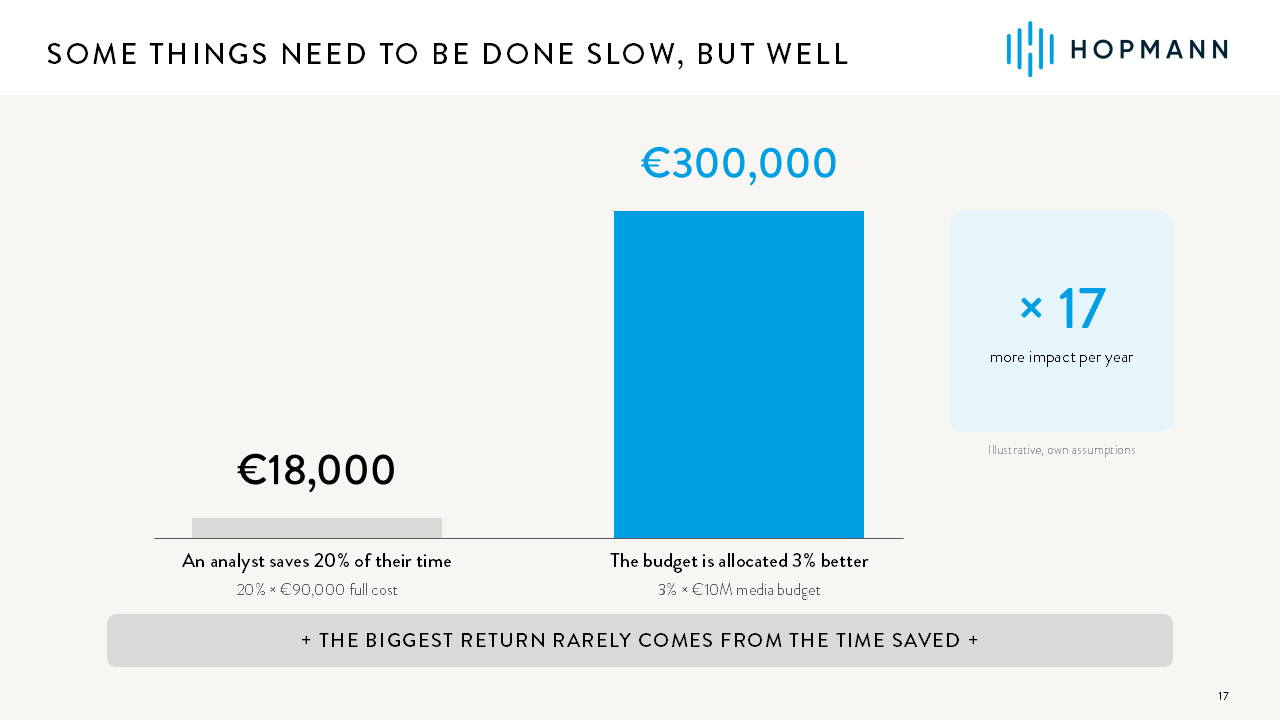
Direction: AI lets everyone produce more reports faster. But impact only comes when that output points in the same direction. A few reliable dashboards that everyone looks at achieve more than hundreds of individual reports. Jörg’s example calculation shows why: the time saved on building reports is the smaller gain. If an analytics team member saves 20 percent of their time, that’s about €18,000 a year. If a shared view of the right metrics leads to a €10 million media budget being allocated just 3 percent better, that’s about €300,000.
Trust: A convincing answer can still be wrong. Our experience from client projects: AI delivers reliable numbers when it doesn’t work directly on raw data but on a solid foundation. In the Hopmann AI Foundation, five layers build on each other:
- Marketing measurement strategy: defines goals, KPIs and the measurement logic.
- Data quality & governance: ensures complete and consistent data.
- Semantic layer: defines how metrics are calculated. Modern BI platforms like Omni already come with a semantic layer built in.
- Context layer: explains why the numbers look the way they do. Jörg’s example: if order volume drops after Christmas because the team that enters orders is on vacation, this context helps the AI interpret the dip correctly.
- Agentic marketing intelligence: AI agents that build dashboards on this foundation, answer questions about the data and flag changes.
Learn more in our article Semantic Layer and Context Layer in Practice.
Governance: BI platforms like Power BI, Tableau and Omni offer access rights, central distribution, consistent KPIs and dependable maintenance. They are opening up to AI and will remain the backbone for the foreseeable future. Together with data platforms like Snowflake, a shared semantic layer and a context layer, they make sure that even self-built AI dashboards show the same numbers across all business teams and put them in the right context. For sensitive data, some tools pass only the schema to the language model, not the data itself. In our projects, we use this approach for Tableau to Power BI migrations, for example.
Key takeaway: AI speeds up building dashboards. The results become reliable through human expertise and a data foundation with clear definitions, context and ownership.
What’s next?
The next Raw & Roasted takes place in early December. We’ll share the date and topic soon on our events page and on LinkedIn.
Want to build dashboards with AI on a reliable data foundation? We’re happy to be your sparring partner, from AI in marketing to choosing the right BI platform. Get in touch.
Questions from the event audience.
FAQ on Dashboards with AI
Can management trust figures generated by AI?
For a quick look at your own data, yes. For management decisions, you also need a solid foundation: accurate data, consistent KPI definitions in a semantic layer, and business context in a context layer. Then the AI delivers the same number as the dashboard.
Where do we maintain the definitions for the semantic layer and context layer?
A good starting point is the metrics in your existing dashboards. Platforms like Snowflake or Omni come with their own semantic layer. Alternatively, you can maintain definitions in Confluence, for example, with a page per department and clear ownership. It’s an ongoing process and more of a business topic than a technology one.